
When clients want quick, accessible insights, I turn to the leading 3rd party visualization tools. In Power BI, I’ve created several ad-hoc visualizations as well as full-fledged dashboards. The Power BI dashboards I’ve created include a project management tool for a large energy client, a fuel-retail analyzer, a maintenance/repair/operations opportunity evaluator, and an account planning tool. In Qlik Sense, I’ve served as the business owner for 4 dashboards that reported on social engineering test results. And in Tableau, I’ve created several infrastructure monitoring dashboards for a large social networking company.
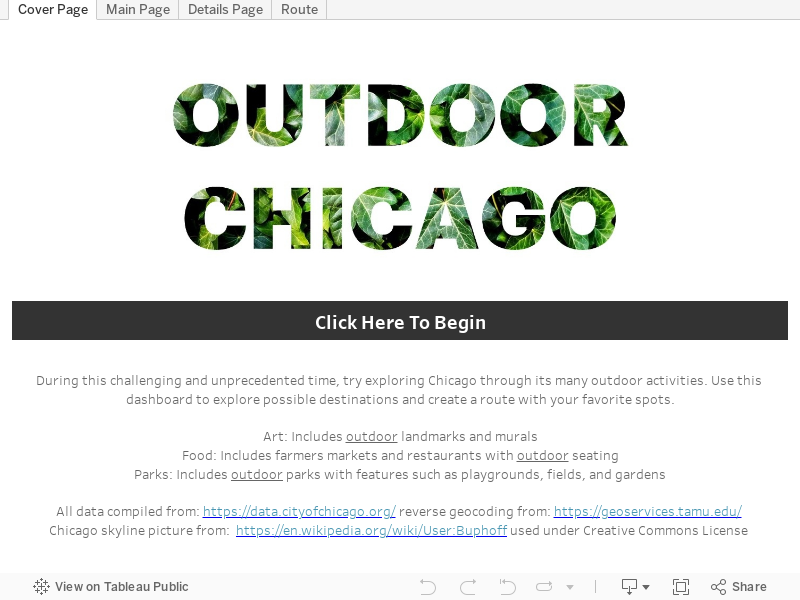
Most of these dashboards contain confidential client information and can’t be shared publicly. However, to get an idea of my designs, explore the Tableau dashboard below that I created in my spare time and submitted to an internal company-wide competition, which was awarded 2nd place.